W4/VP9KF

W4/VP9KF Logo

W4/VP9KF


 RSS news feed help F:184 A:13 K:2.00 SSN:148  WWV Log VP9KF, G4BKI & EI6LC
Last reload: 2024-12-21 09:58:03Z

Latest WWV data: 2024-12-21 09:45:04Z

Data policy  Disclaimer

menu
Home  | CW/CEPT  | Propagation  | VP9KF  | G4BKI  | G4BKI/J3 & J37KF  | Log  | Software  | IP Ham  | Blog  | CW Links 
  CW Club Call History Files  | Telnet Files  | N1MM+ Logger tips  | Logger32 tips  | Applications - Latest Versions  | Units"Forecastfox" replacement
W4/VP9KF - Propagation

PROPAGATION
eHam
RSGB Propagation Committee
NA5N/GQRP Propagation [PDF]
Hfradio.org
DXLC
Grey Line
Propagation Modes
Propagation Notes IPS (PDF)
Propagation Notes AE4TM
Propagation Notes AE4RV
RBN  DXWatch DXfun DXCluster
PSK  DXMaps  DXHeat
REAL TIME IONOSPHERE
SuperDARN radar measurements
JPLTEC map total electron content
Auroral RT CSSDP
TIMED MLTI
CAPS    Spacewx.com  
CAPS/Earth Space 4D
SONDES (WIP)
UMLCAR world wide
NGDC dynasondes
UMLCAR world wide
Wallops Is ionosonde
San Juan ionosonde
Boulder ionosonde
Tromso ionosonde
Svalbard ionosonde - off?
IRF (Sweden) ionosondes
PROPAGATION - WEB BASED
VOACAP Point-to-point Area
ITURHFProp Point-to-point Area
PROPAGATION SOFTWARE
Miniprop (W6EL) 
ICECAP / ICEAREA / VOACAP / VOAAREA (son of IONCAP) the professional predictor
Guide to using VOACAP very good
HamCap – graphical interface for VOACAP  SSN file to 2031
VOAProp – graphical interface for VOACAP  SSN file to 2023 
WinCap Wizard – graphical interface for VOACAP
ASAPS
PROPLAB-PRO
Space Weather
DX Toolbox
PropView  DXView
JHelioviewer
OTHER SOFTWARE
DXAtlas
DXMonitor
BEACONS
International Beacons
BeaconSee analysis tool
OTHER SOLAR INFORMATION
Solar Rotation – more complex than you’d think - more
More about the forecasts
How can SOHO all of the time?
N'tl Solar Obervatory (USA)
Glossary
Space Weather (AGU)
PAST MISSIONS
Ulysses 
POES 1 and 2   
BARREL 2009-2015 
CURRENT MISSIONS
SOHO (L1)
Mission
Payload
Instruments
(Wikipedia)
What’s a CCD Bakeout?  Schedule
DSCOVR - testing at L1 point
GOES Where is GOES 15? 13?
ACE (L1)  Real Time Shocks
WIND (L1)
STEREO - NASA Where are they? 
STEREO - APL
STEREO - Rutherford
STEREO - Goddard  STEREO RSS News
COSMIC Where are they?  
THEMIS Where are they? 
SDO Where is it? Due for launch in 2010-01
VAP Launched 2012-08-30   IRIS 
Neutron Monitors 
LAUNCH SCHEDULES
NASA
Ariane
FUTURE  MISSIONS 
GOLD
LWS - Living with a star
ICON
Solar Probe Plus (July 2018)
Solar Orbiter (Feb 2020)
SET Sept 2016 
PUNCH and TRACERS
OTHER SITES 
F5LEN - très bien
SolarCycle24 - now solarham
SANSA

Propagation  (page reloads every 12 minutes)

solmon_table

SolMon
Geomagnetic Field A
Geomagnetic Field Kp Solar X-ray status Proton status Neutron Event status
Local Data: K-Index Released A-Index Released Released Warnings pretty infrequent Warnings only a few times per cycle
Last changed: 2024-12-21 09:05:06Z
2024-12-21 09:05:06Z
2024-12-21 09:44:42Z
2024-12-21 09:44:40Z
solmon_table

N3KL
Geomagnetic Field Solar X-ray status
Data Derived: Don't believe what you see here Don't believe what you see here
solmon_table

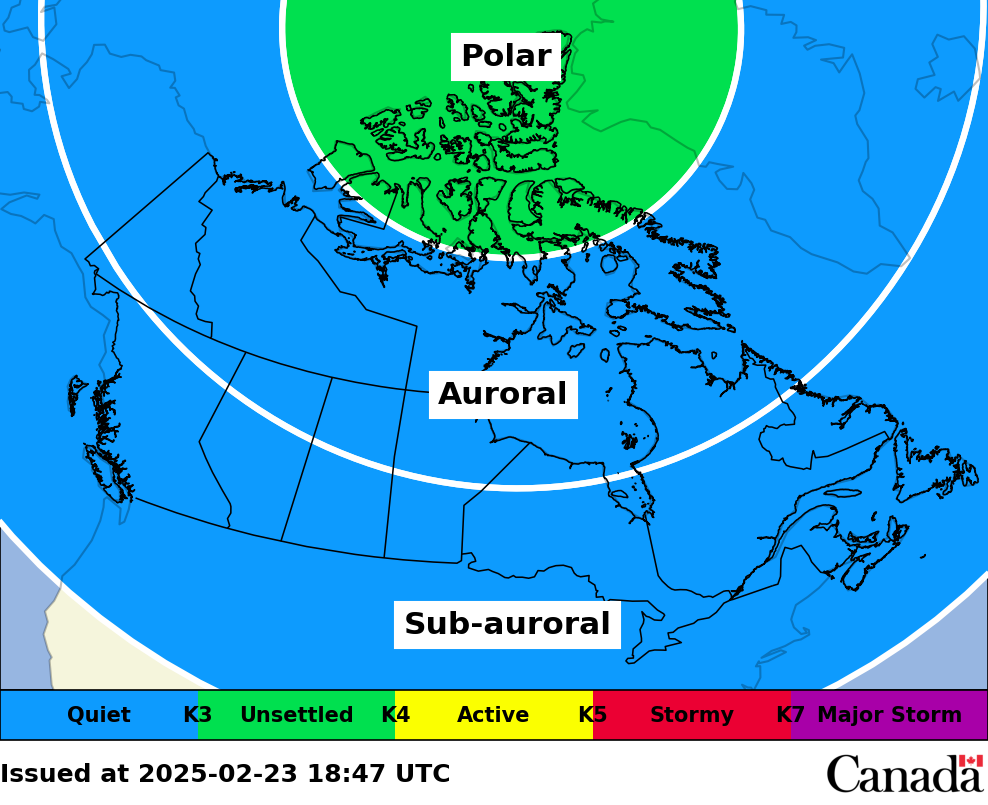
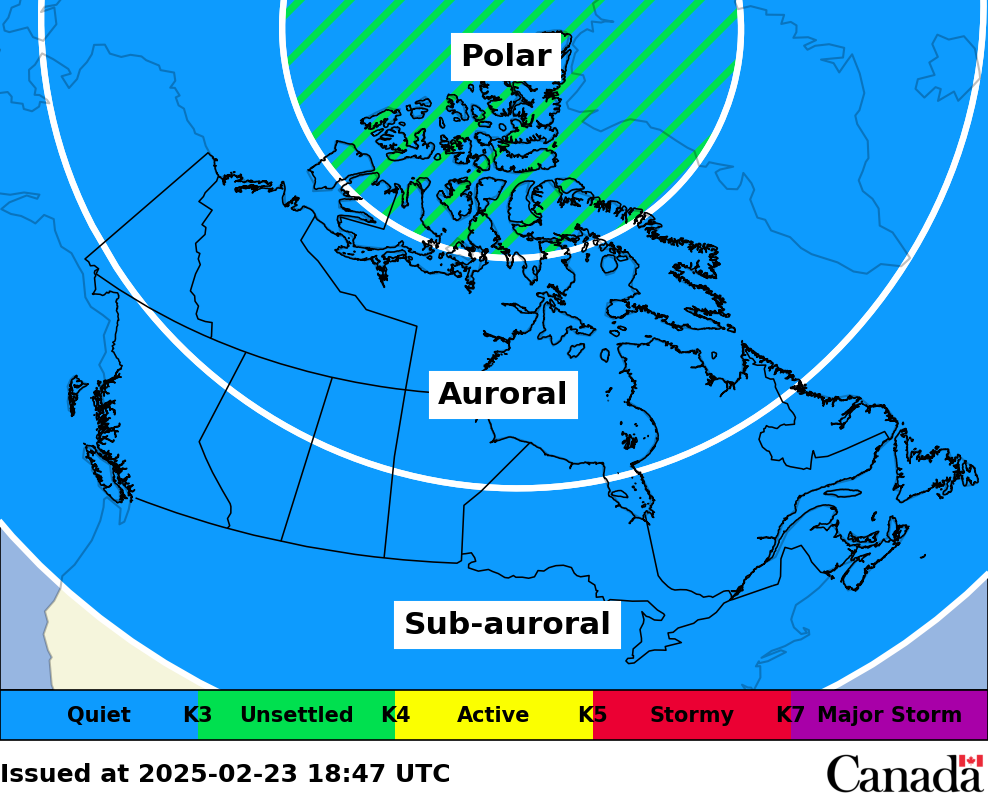
Zone
Current
Forecast (6hr)
POLar
Current: Polar Forecast (6hr): Polar
AURoral
Current: Auroral Forecast (6hr): Auroral
SUBauroral
Current: Sub-Auroral Forecast (6hr): Sub-Auroral
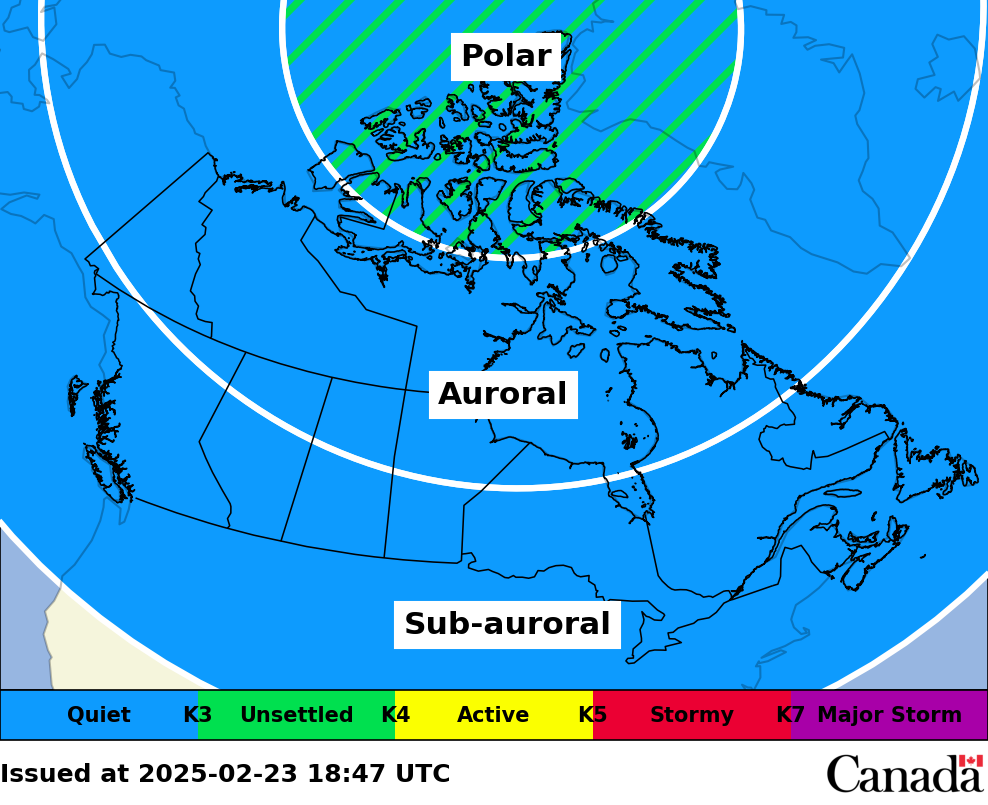
solmon_table_ca

SolMonCA
Current +6hr +24hr
POL / AUR / SUB Data Current plus 6 hours plus 24 hours


Quick (Simple) look data

[Up to] Previous 7 days
Next 72 hours [or more]


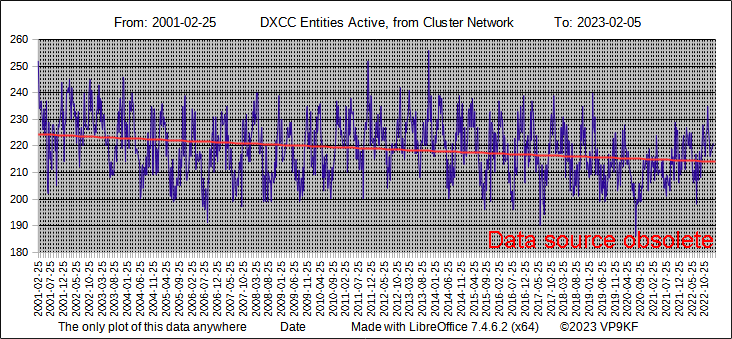
DXCC Entities Active
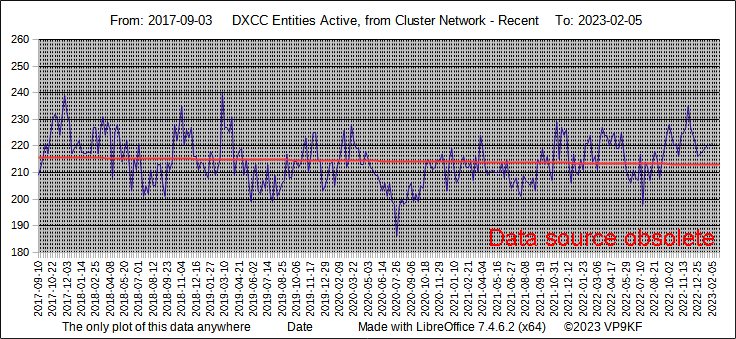
DXCC Entities Active - short term graph
This shows, no matter what, about 200 different entities are available every week.
The graphed data could contain "Pirate/SLIM" operations or "busted" callsigns.
You never know. So 'Work First Worry Later'.
This data is now Open Source. You can download here, in .ods format (LibreOffice Calc)
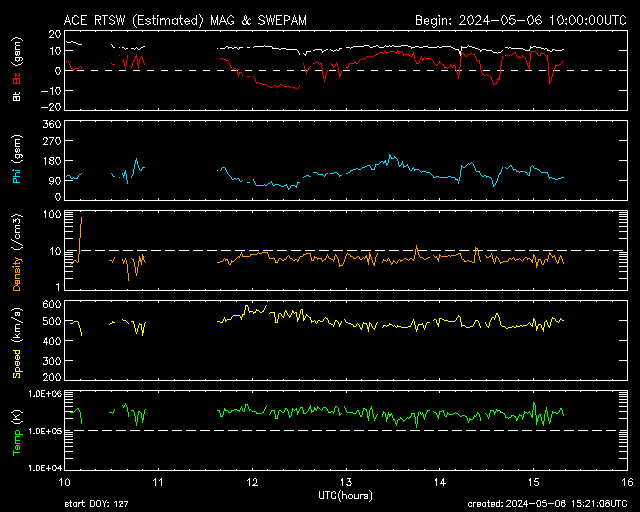
ACE Magnetic Field data 7d 3d 24h 6h 2h
Combined data   F:184 A:13 K:2.00 SSN:148   2024-12-21 09:45:04Z
ACE RTSW MAG 6 hour graph
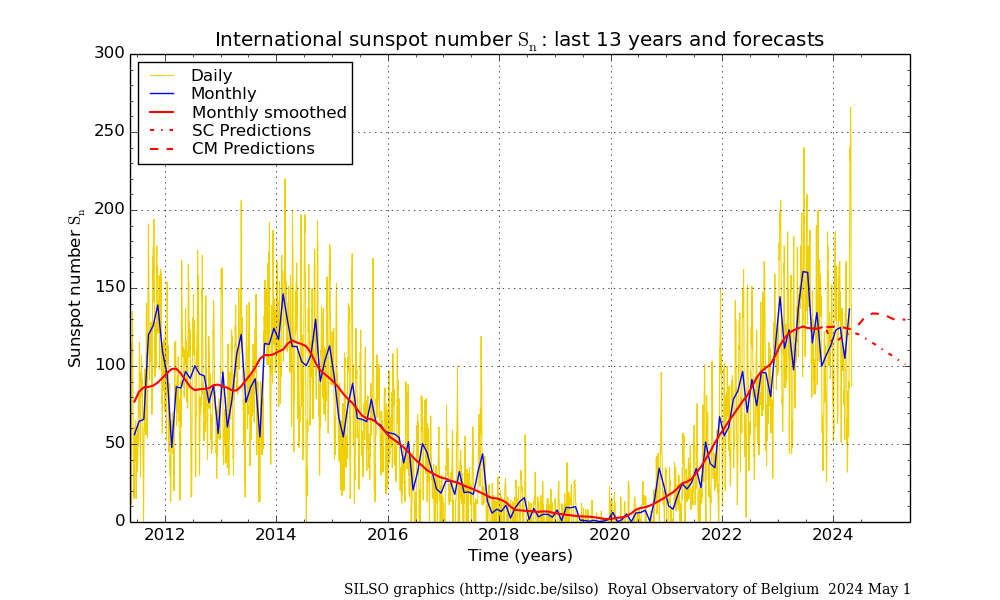
Solen SFI, A & SSN Click for forecast page
Full SSN forecast page

Propadex - a propagation index Divide the number shown here by 100 to calculate the number of MHz that MUF is up or down compared to the last 60 days at the current time. Updates every 15 minutes. Raw data: Wallops Island VA, San Juan PR & Boulder CO ionosondes.

Rigreference data


F6GCI solar data page
  F5LEN solar forecast
X-ray plot (1min/3d) and X-ray plot (1min/6h)
Kp Index Plot(3h/3d)
Space Weather Now (NWS)
eSSN (24hrs)
Space Weather
Space Weather Canada  Penticton Solar Flux
Sun Nearside & FARSIDE images: 1 | 2 | 3   (SOHO/MDI, SOHO/SWAN, SOHO/SWAN)
Latest SOHO images
Forecast based on current data*
Active Region Monitor
STORM Ionospheric correction factors
Coronal Mass Ejection movie**
WARNINGS currently in effect
Current D layer Absorption
Real Time MUF
VRML (3D) view of Coronal fields* (VRML viewer required)
Mount Wilson Sunspot Count  note this is drawn "backwards"
DXRobot (GoodDX)
The Lookers Blog
DXAnywhere Figures
*

*Broadband required     * Huge memory resources needed for Flash  * Try using: GIF Toggle  add-on for Firefox or GIF Scrubber extension for Google Chrome


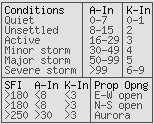
:Product: Geophysical Alert Message wwv.txt
:Issued: 2024 Dec 21 0905 UTC
# Prepared by the US Dept. of Commerce, NOAA, Space Weather Prediction Center
#
#          Geophysical Alert Message
#
Solar-terrestrial indices for 20 December follow.
Solar flux 184 and estimated planetary A-index 13.
The estimated planetary K-index at 0900 UTC on 21 December was 2.00.

Space weather for the past 24 hours has been minor.
Radio blackouts reaching the R1 level occurred.

Space weather for the next 24 hours is predicted to be minor.
Radio blackouts reaching the R1 level are likely.


Magnetic field reversal now complete, the cycle has completed and should now be heading towards Cycle 25!


Did you know:  Radiation from Space Weather creates the ionosphere, affects astronauts and destroys satellites.


Flares & Coronal Holes
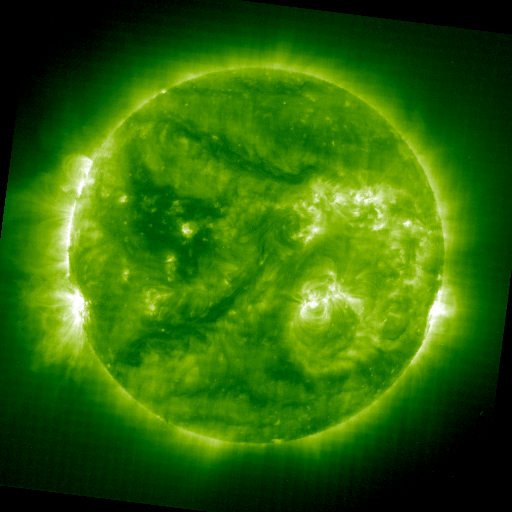
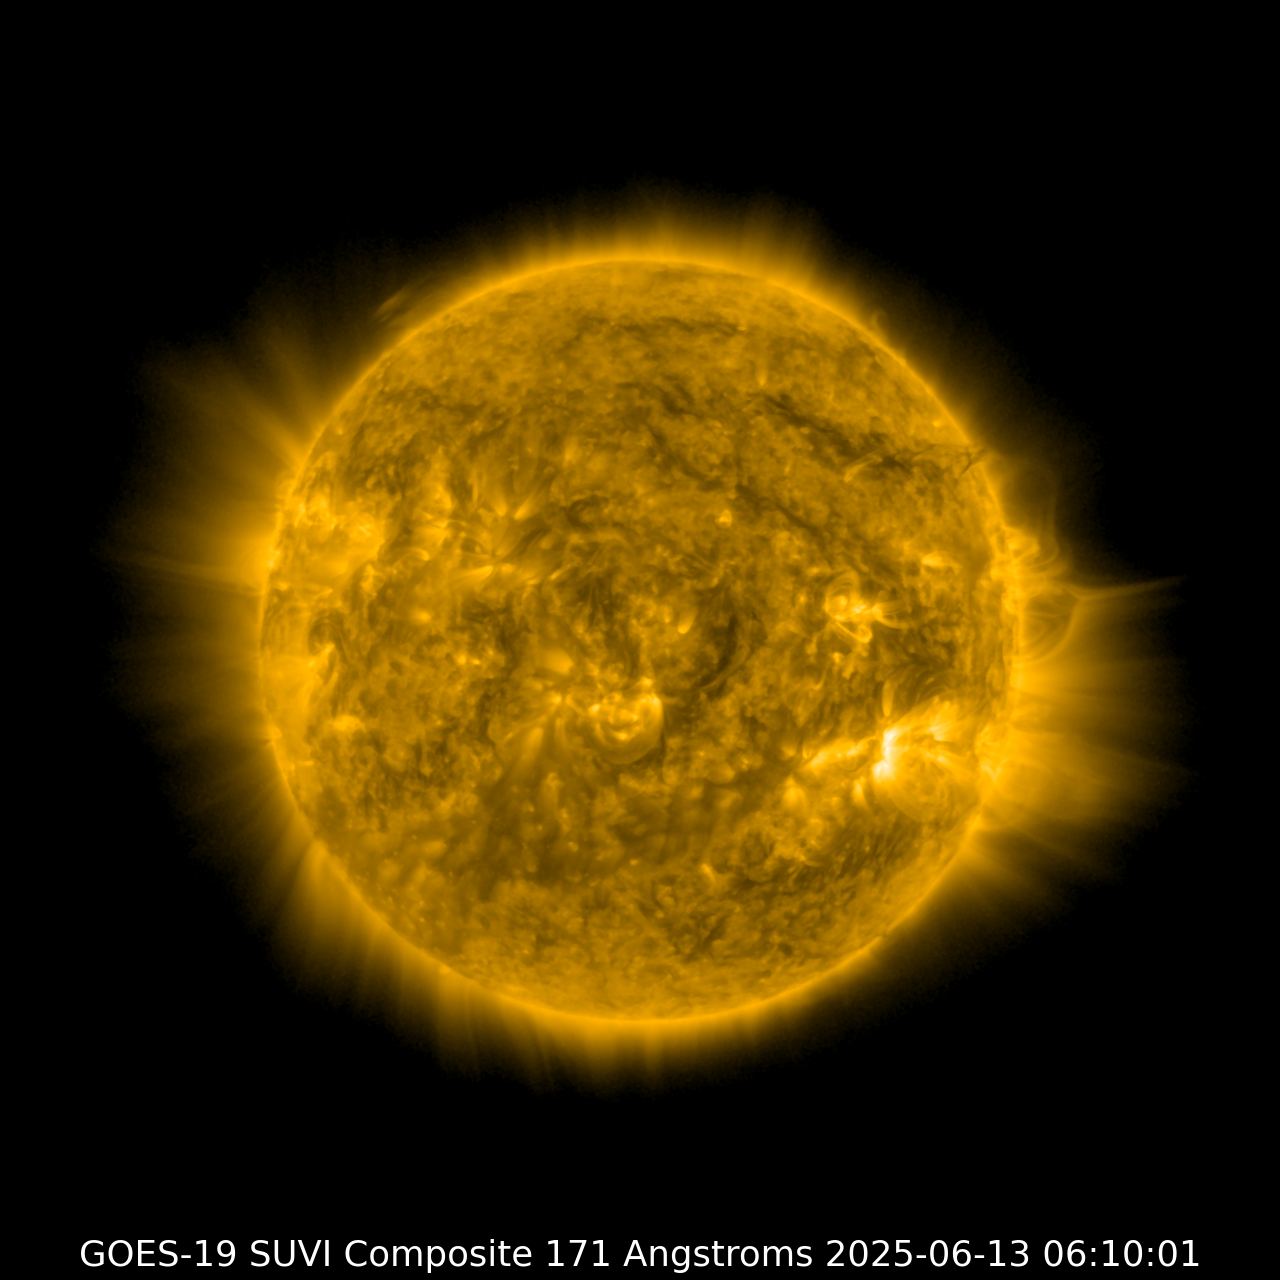
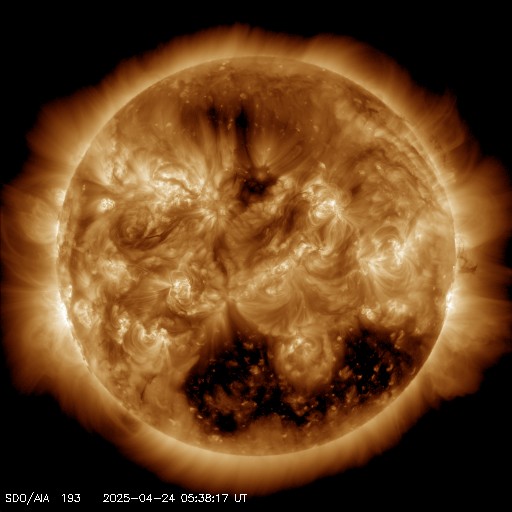
SUVI Extreme UV195Å
Fe XI, 1.5MK

Flares & Coronal Holes
SUVI Extreme UV 284Å
Fe XV, 2MK

Flares & Coronal Holes.
SUVI Summary

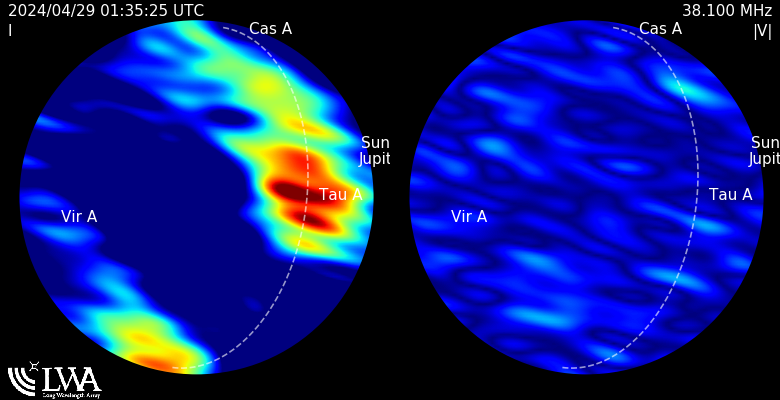
Nancay
0.9m

Not Real Time

Nancay
1.8m

Not Real Time

Flares & Coronal Holes
SUVI Extreme UV 171Å
Fe IX/X, 1MK

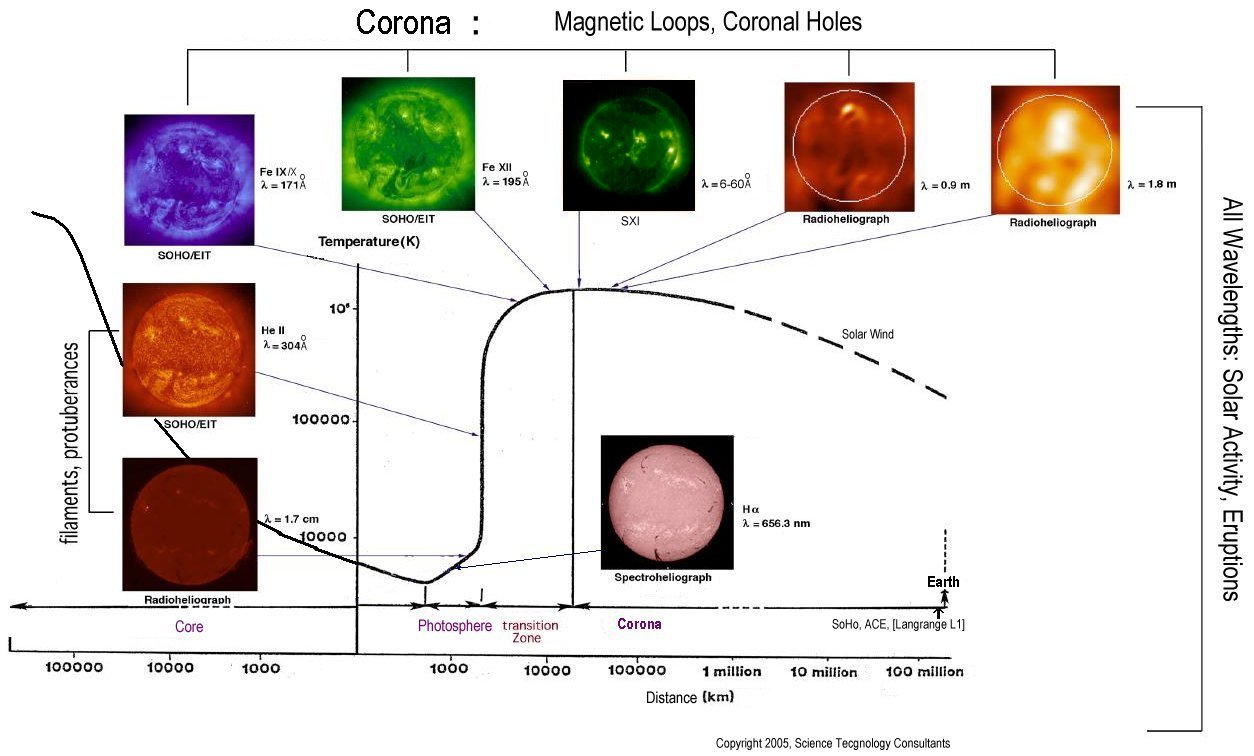
These real-time images follow around the above graphic, except that:

EIT 284Å is an additional image

VHF/UHF images are not taken in real-time


Handy Electromagnetic Spectrum Calculator

Flares & Coronal Holes
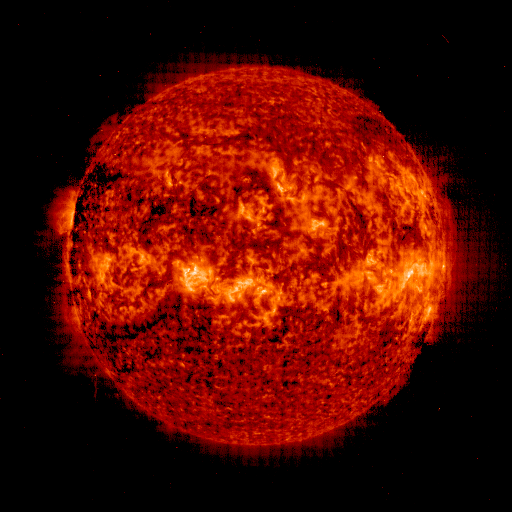
EIT Extreme UV 304Å
He II, 20kK~100kK

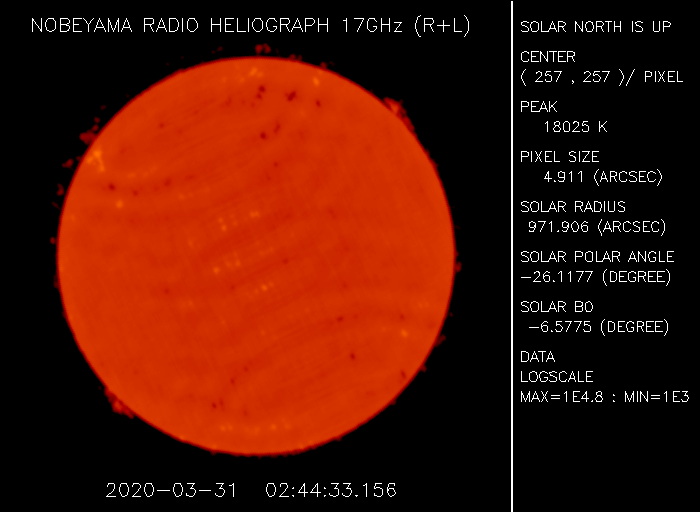
DOWN due to SARS-Cov-2? Flares & Coronal Holes
Nobeyama 1.7cm (17GHz)

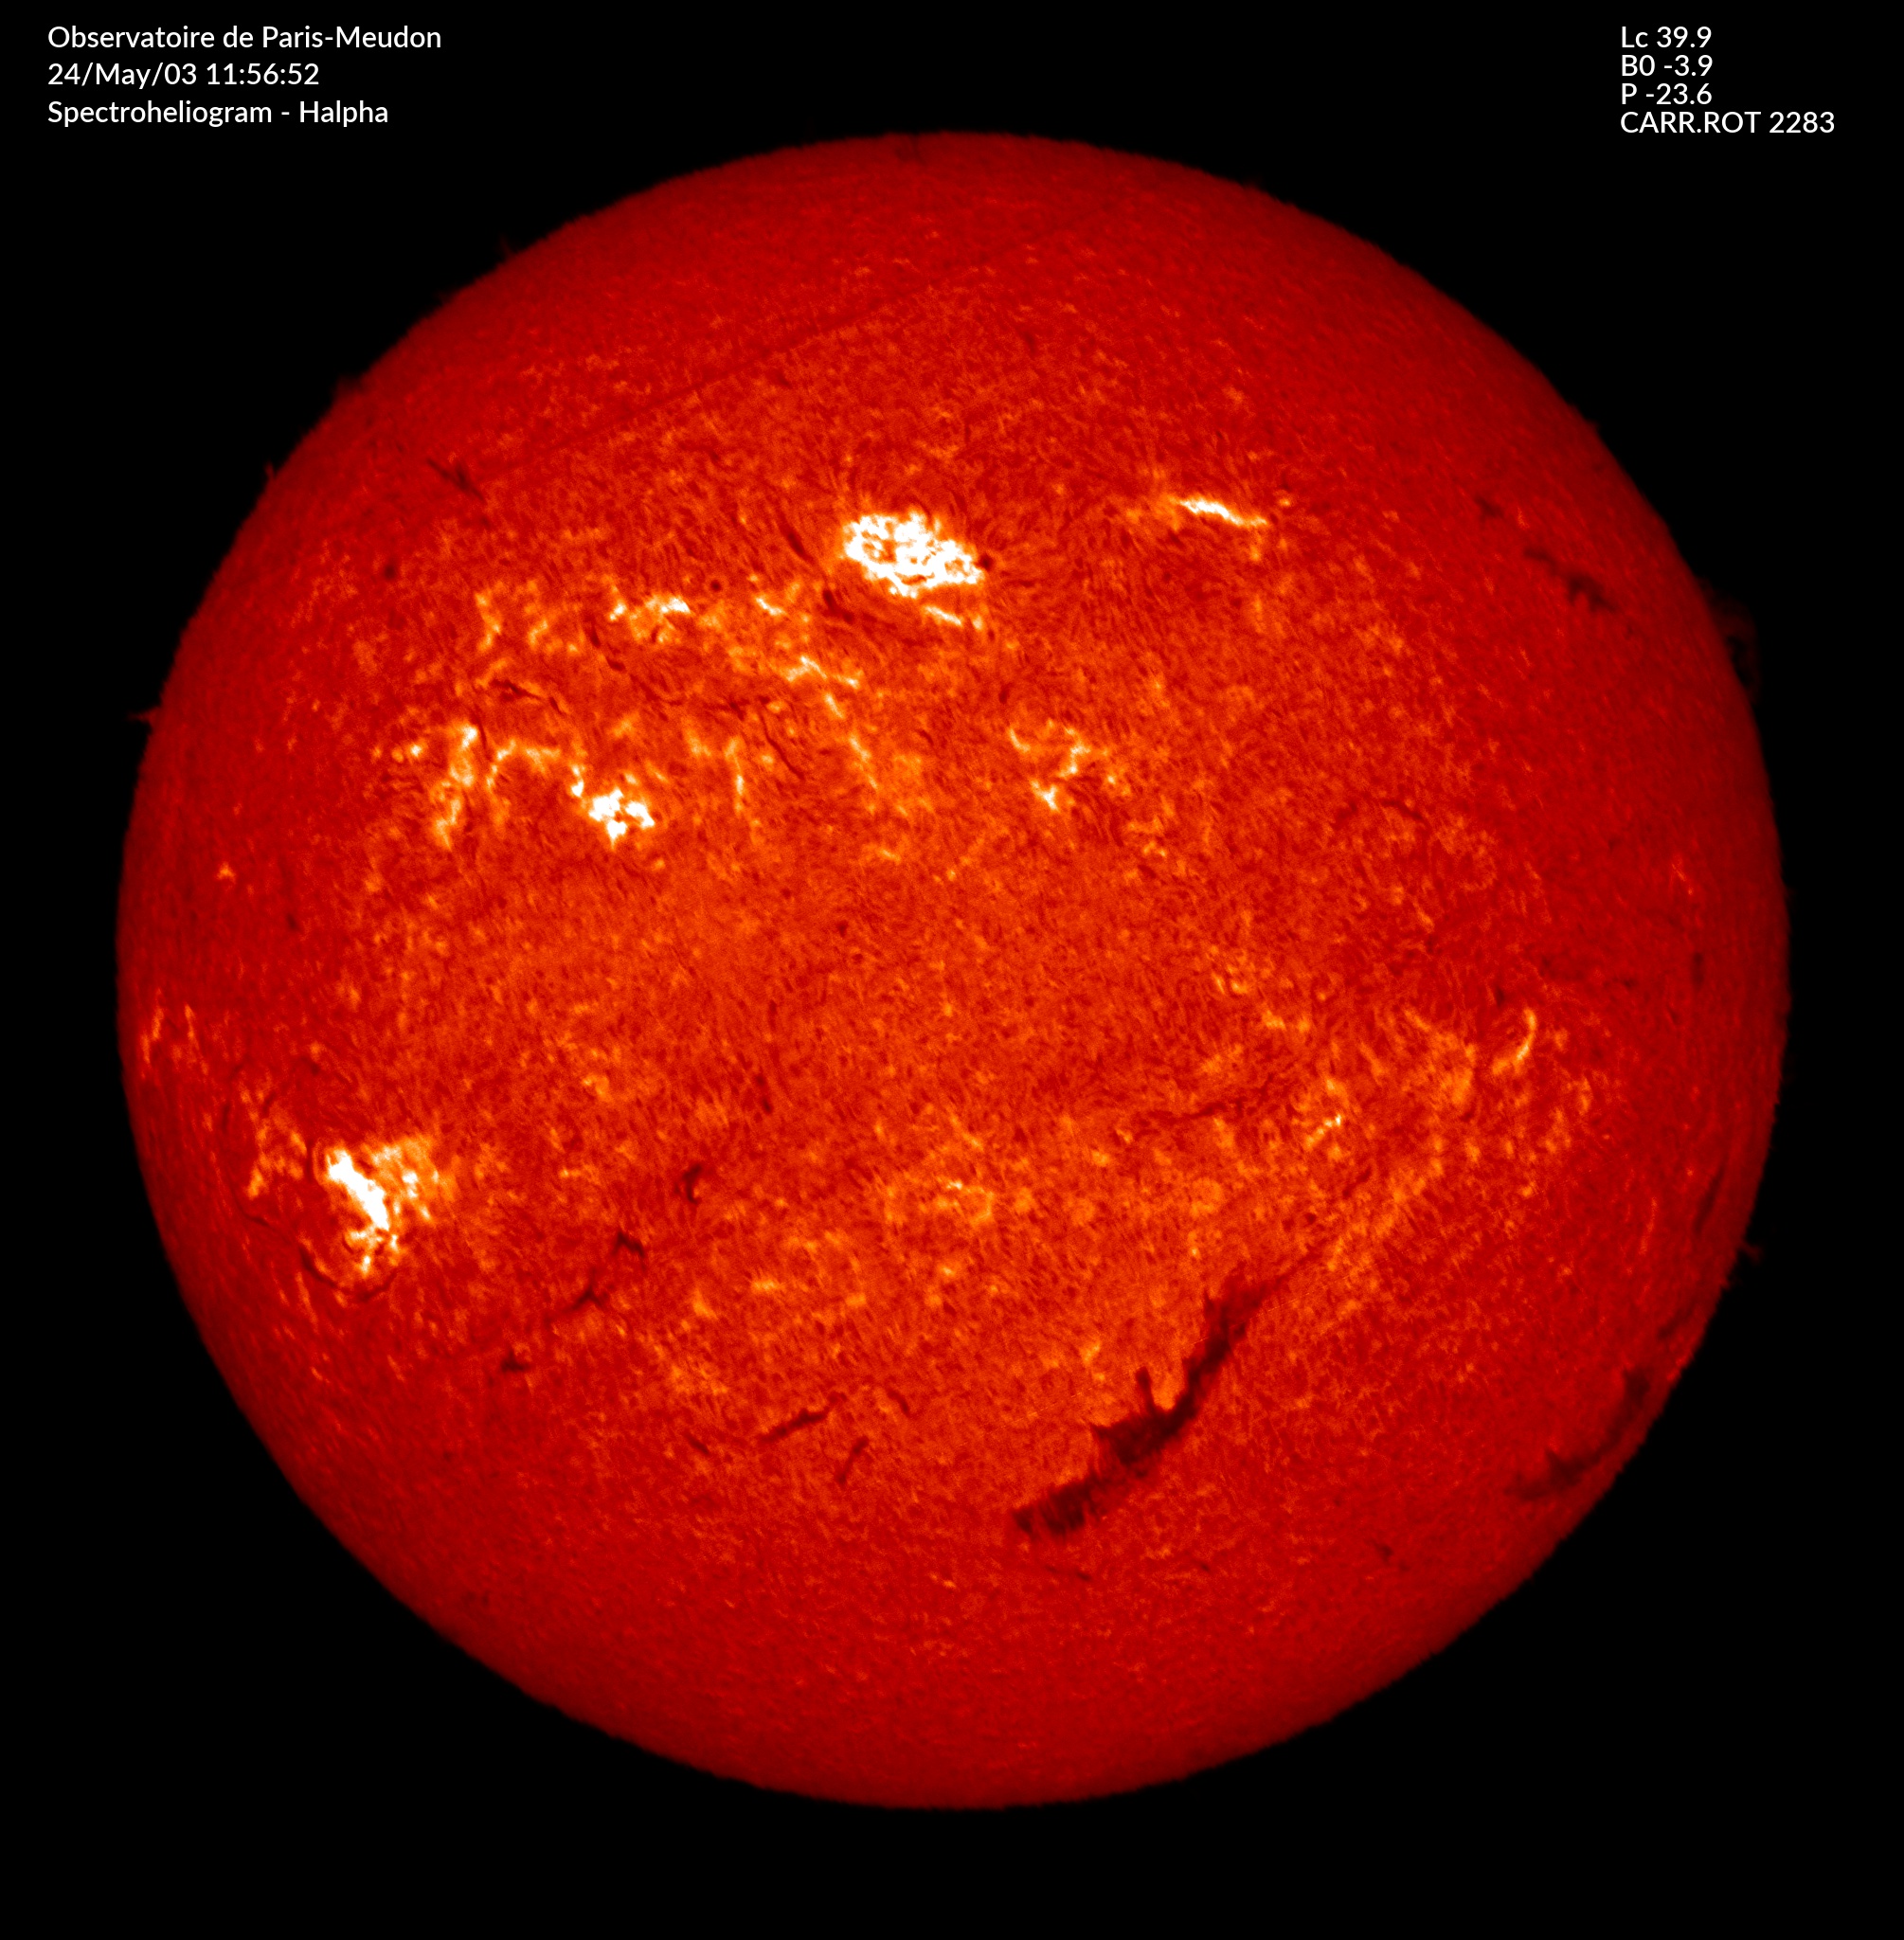
Flares & Coronal Holes

Meudon Hα 6563Å

GOES X-ray flux - 5 minutes GOES X-ray flux - 1 minute
GOES-16 X-ray Flux (5 minutes) GOES-16 X-ray Flux (1 minute)

GOES Electron flux - 5 minutes GOES Proton flux - 5 minutes
GOES-16 Electron Flux (5 minutes) GOES-16 Proton Flux (5 minutes)

Kp index - 3 Hour Combined - 1 minute
K Index (3 hours) Combined (1 minute)
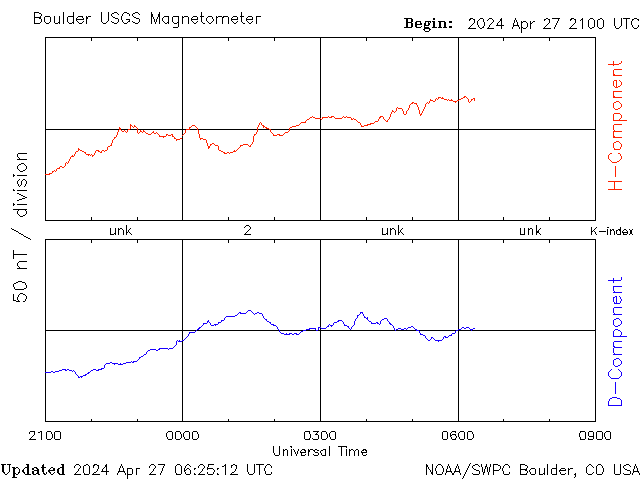
GOES Magnetometers - 1 minute Magnetometer - 1 minute
GOES-16 Magnetometers (1 minute) Boulder Magnetometer (1 minute)

 
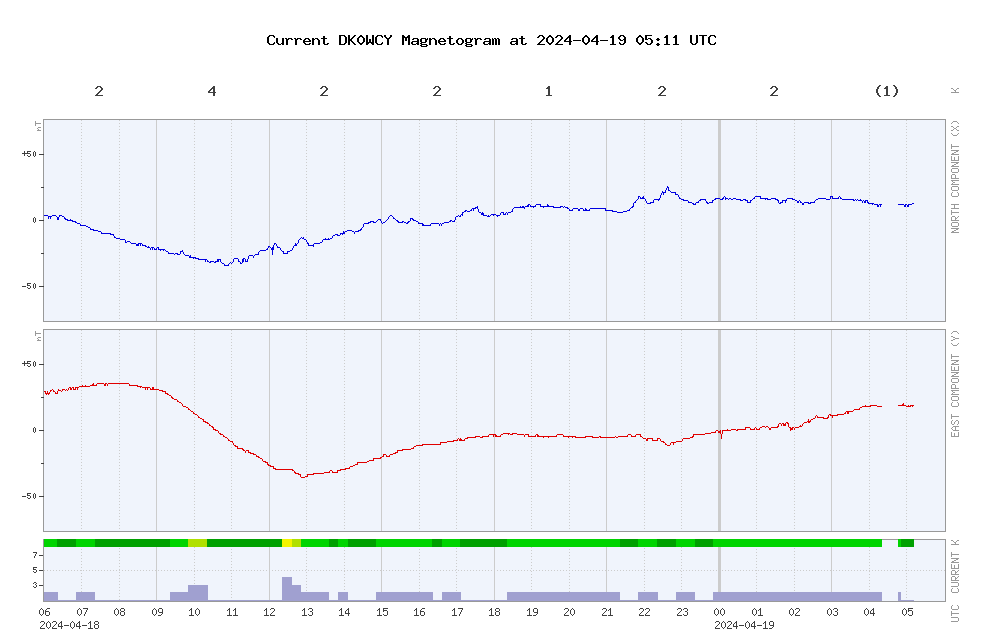
Kiel magnetometer
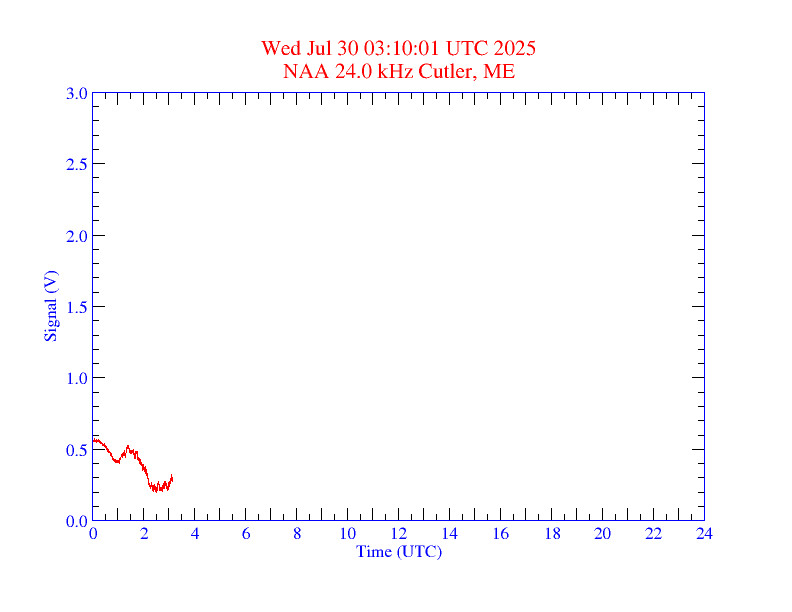
NAA 24kHz signal - use for flare detection
'Kiel' magnetometer ~location 1 minute resolution
VLF 24kHz signal from NAA Cutler,Maine to Louisville, Kentucky


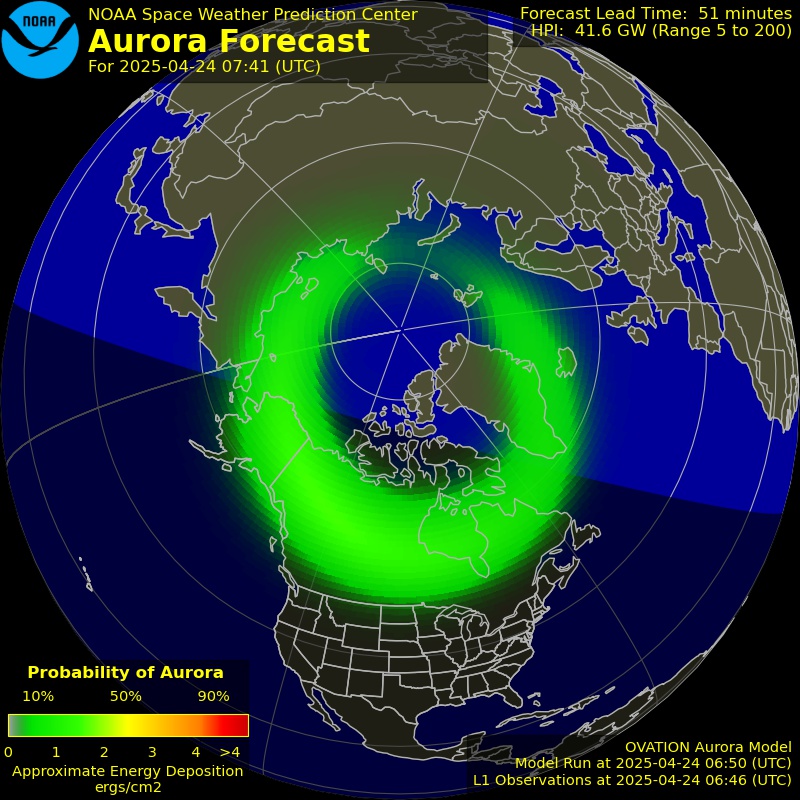
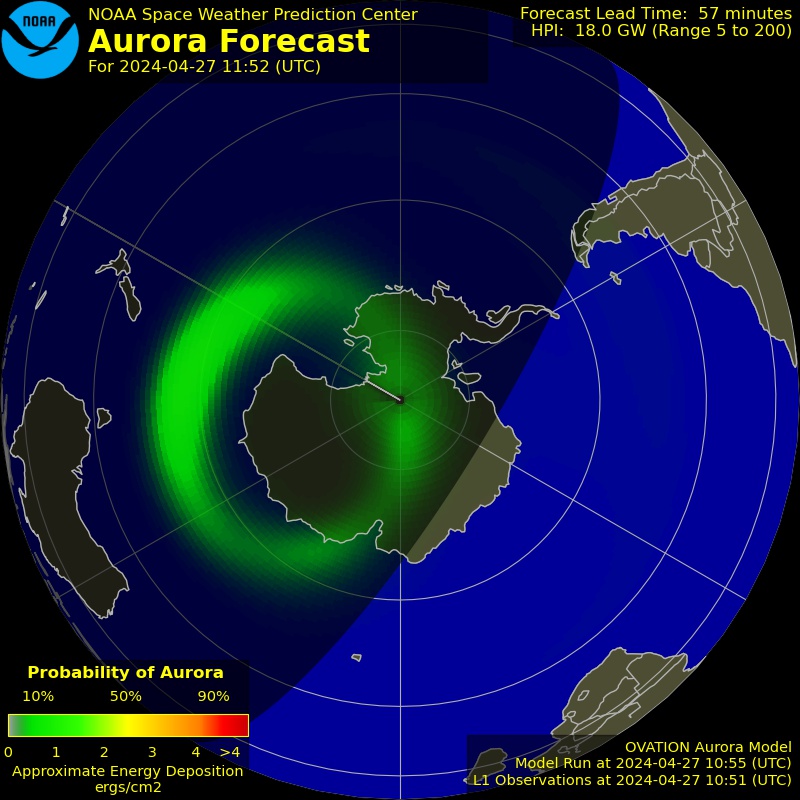
 POES data and OVATION Aurora Prediction

3 day North Pole 3 day South Pole
North Pole - 3 day
South Pole - 3 day

North Pole forecast - 30 minutes
South Pole forecast - 30 minutes
Both SOHO and ACE are located at the L1 point between the Earth and Sun. This is about 1.5m km from Earth (or 932,000 miles).

From this vantage point Solar wind data can be detected about 45 to 60 minutes before reaching Earth.

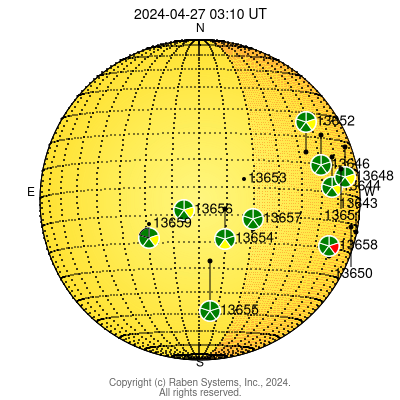
Earthside - Raben Systems Farside - Raben Systems
Front Side Far Side

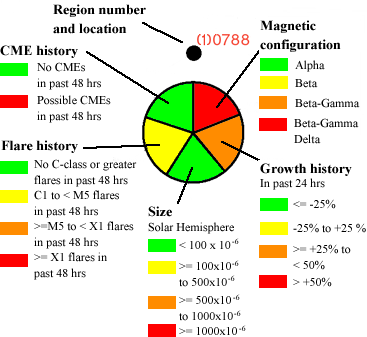
Key to solar history above

SDO - Soft X-ray image


Server is down Server is down
SDO (straight-on view) [193Å] (SoHO 195Å) STEREO-A - to the East (looking around back of Sun)
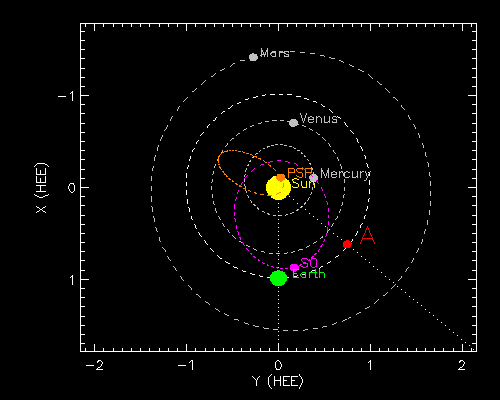
Browse Latest Images STEREO B is of most interest to us B: Separation angle with Earth 36.65° = 2.85 days = 68.41 hours
A: Separation angle with Earth 28.69° = 2.23 days = 53.55 hours

STEREO - receiving the data.
Between April and June 2015 the datalink didn't reach the Earth. Why? The angle B-Earth is gradually increasing, at the rate of about 0.3 degrees per month. When this gets too large, the signals had to graze the Sun to reach Earth. If the satellites survive ecllipse and the increasing solar activity, then they will remain extraordinary solar sentinals. Antenna pointing is restricted, so signal recovery may be marginal.
-90°/+90° coverage was achieved in February 2011. With SDO/SoHO that should ensure 360° coverage until 2019 - or until instrument/probe failure or de-funding occurs.
STEREO Information
 Server is down


SOHO Magnetogram - server down SOHO MDI - Sunspot indications - server down
SDO Magnetogram SDO MDI - Sunspot indications
How magnetism varies cycle-to-cycle: NORTH=WHITE, SOUTH=BLACK. [polarity is read from left to right]
Cycle 23 (May 1996): In the sun's northern hemisphere, all spots were S-N. In the southern hemisphere, all spots were N-S. 
Cycle 24 (Jan 2008): Northern sunspots are N-S while southern sunspots are S-N. 
This reversal occurs each time one cycle gives way to the next. It is called Hale's Law.

SWAP EUV SoFAST flare detection

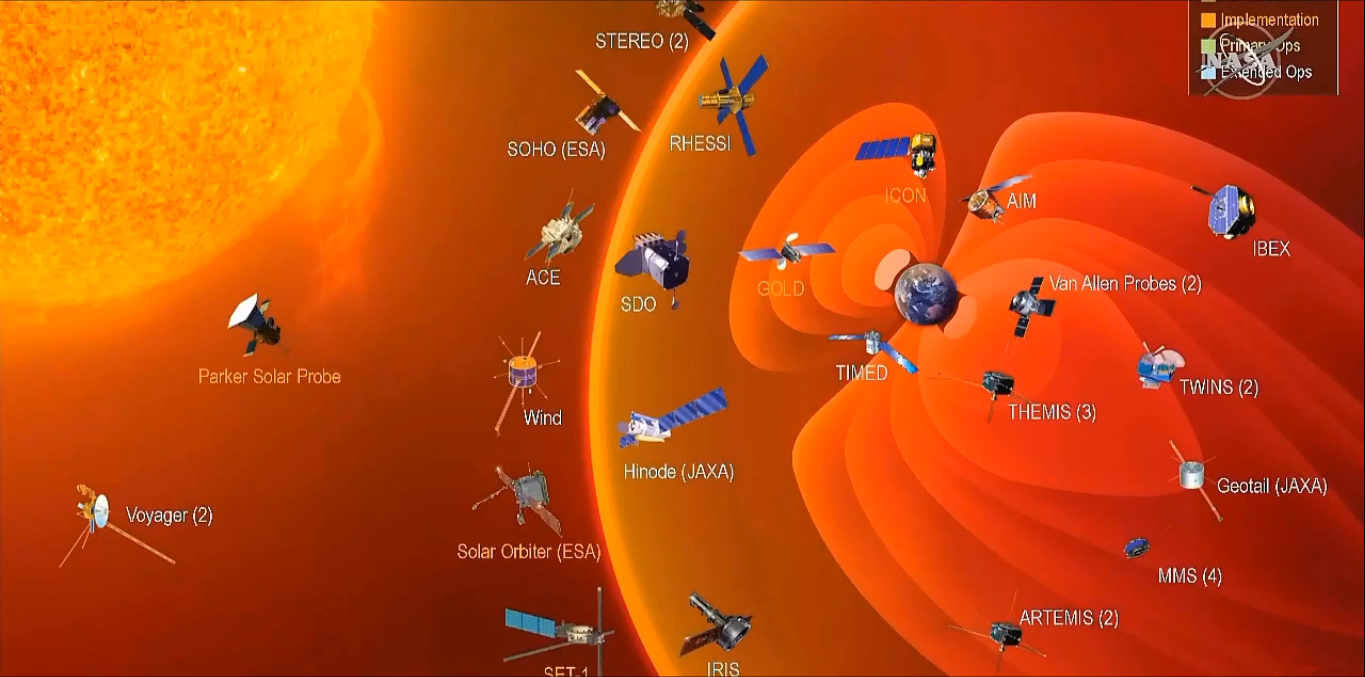
Probes currently in space

UTC


Data on this page courtesy of: esa/SOHO, NASA, Solar Terrestrial Dispatch, Stanford University (Solar Oscillations Investigation group),
spaceweather.com, NW Research Associates, NOAA/SWPC (Space Weather Prediction Center), Lockheed Martin (Solar & Astrophysics Laboratory)
Raben Systems, Inc., n2yo.com, Deep Space Network and the hundreds of ground support team personnel involved in these projects.

footer
  © 2003-2024 W4/VP9KF, Paul H. Evans. All rights reserved. IP footer
User Agent: Mozilla/5.0 AppleWebKit/537.36 (KHTML, like Gecko; compatible; ClaudeBot/1.0; +claudebot@anthropic.com) IP Address: 18.217.60.167